Reports Management
Reports in simpleBillBook provide valuable insights into your business performance, helping you make data-driven decisions. This guide covers all available reports, how to generate them, and how to interpret the data for better business management.
Overview of Reports
Reports help you:
- Track Performance: Monitor sales, purchases, and profitability
- Comply with Regulations: Generate GST-compliant tax reports
- Manage Inventory: Track stock levels and movements
- Control Costs: Analyze expenses and identify savings opportunities
- Make Decisions: Base business decisions on accurate data
Reports Dashboard
To access reports:
- Navigate to Reports from the main sidebar
- You'll see the main reports menu categorized by business function
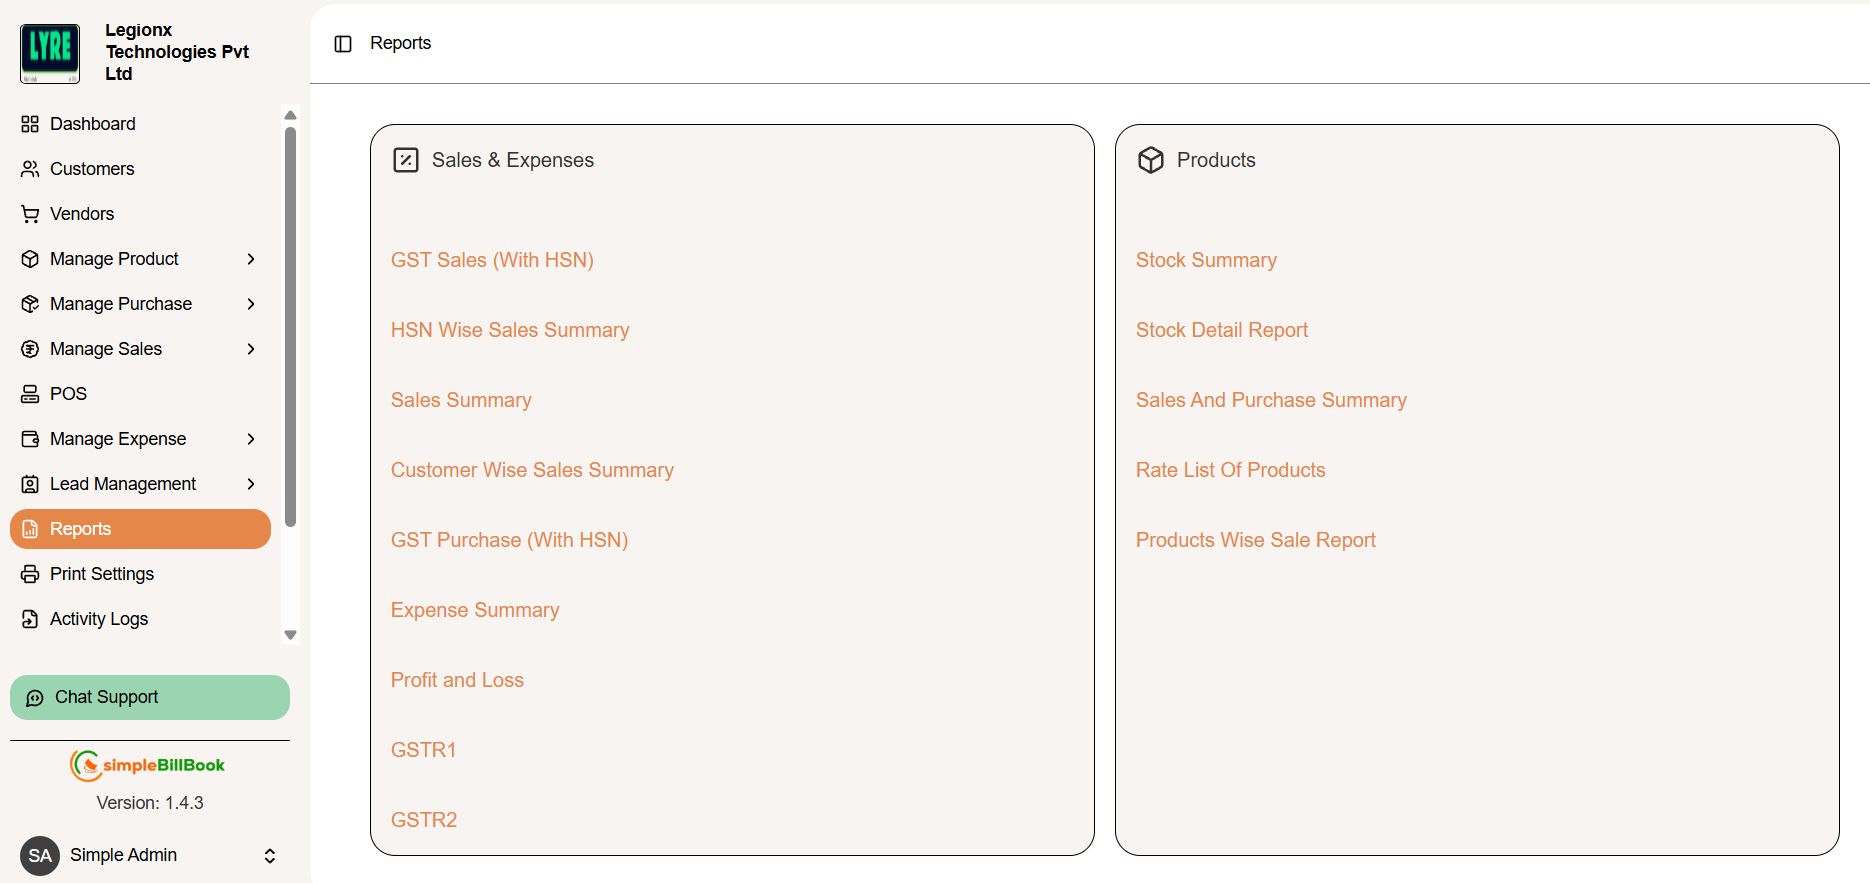 Figure 1: Reports dashboard showing all available report categories
Reports Categories:
Sales & Tax Reports
- GST Sales (With HSN)
- HSN Wise Sales Summary
- Sales Summary
- GST Purchase (With HSN)
- Expense Summary
- Profit and Loss
- GSTR1
- GSTR2
Inventory Reports
- Stock Summary
- Stock Detail Report
- Sales And Purchase Summary
- Rate List Of Products
- Products Wise Sale Report
Sales & Tax Reports
1. GST Sales Report (With HSN)
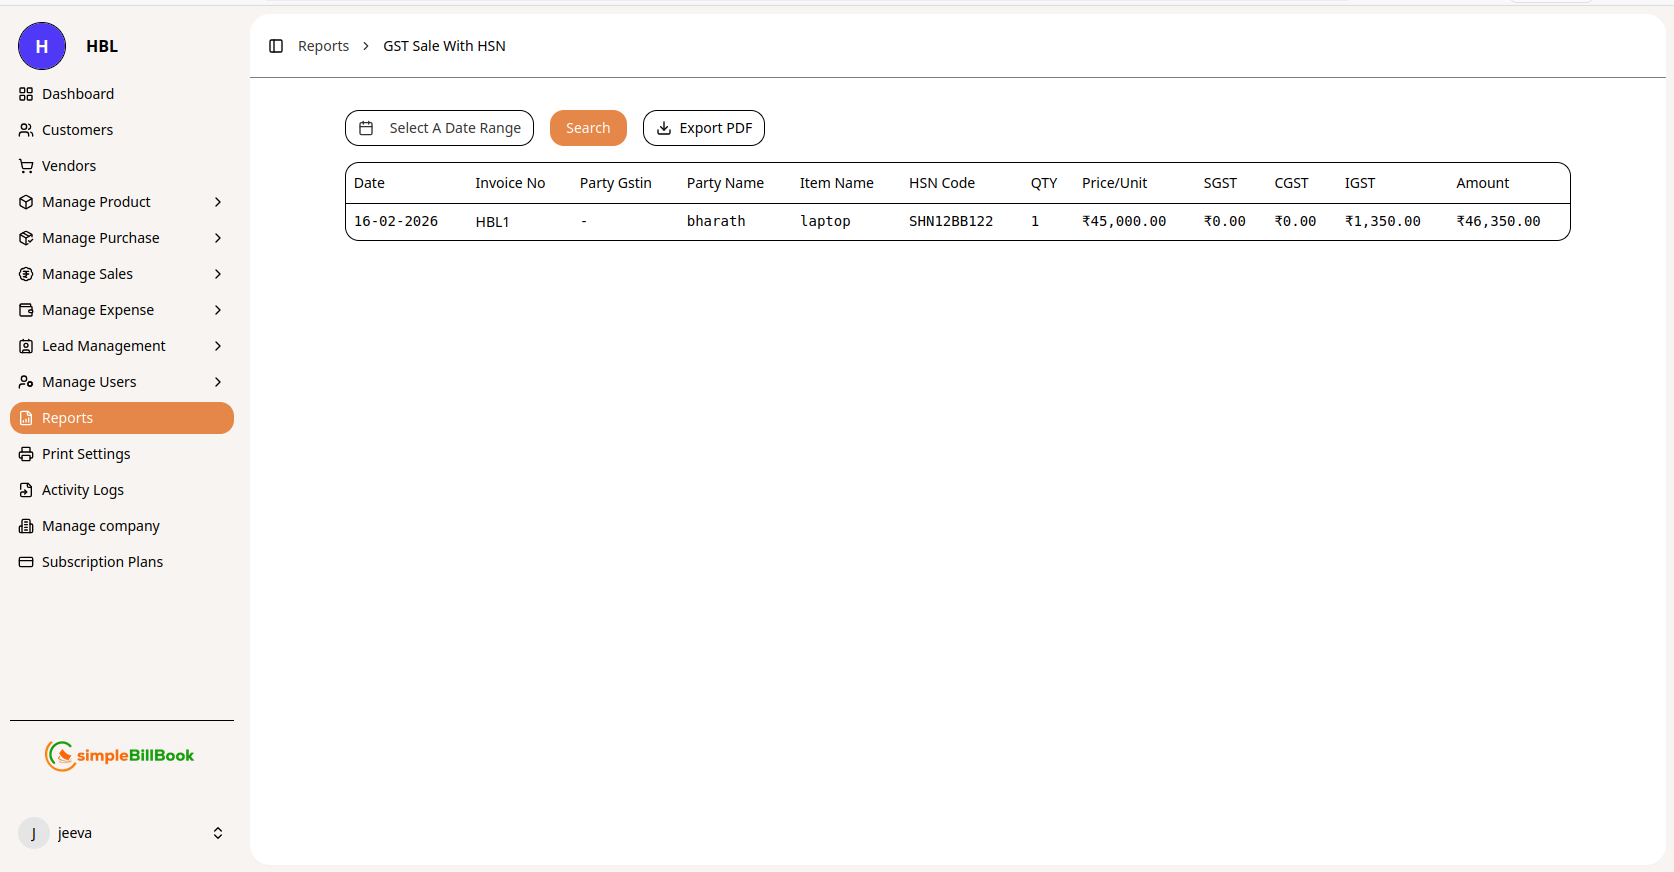 Figure 2: GST Sales report with HSN code details
Purpose: Generate GST-compliant sales reports with HSN code classification for tax filing.
Report Columns:
| Column | Description |
|---|---|
| Date | Invoice date |
| Invoice No | Unique sales invoice number |
| Party GSTIN | Customer's GST Identification Number |
| Party Name | Customer name |
| Item Name | Product or service sold |
| HSN Code | Harmonized System of Nomenclature code |
| QTY | Quantity sold |
| Price/Unit | Selling price per unit |
| SGST | State Goods and Services Tax amount |
| CGST | Central Goods and Services Tax amount |
| IGST | Integrated Goods and Services Tax amount |
| Amount | Total invoice amount |
Features:
- Select A Date Range: Filter by custom date period
- Search: Find specific transactions
- Export PDF: Generate printable PDF report
2. HSN Wise Sales Summary
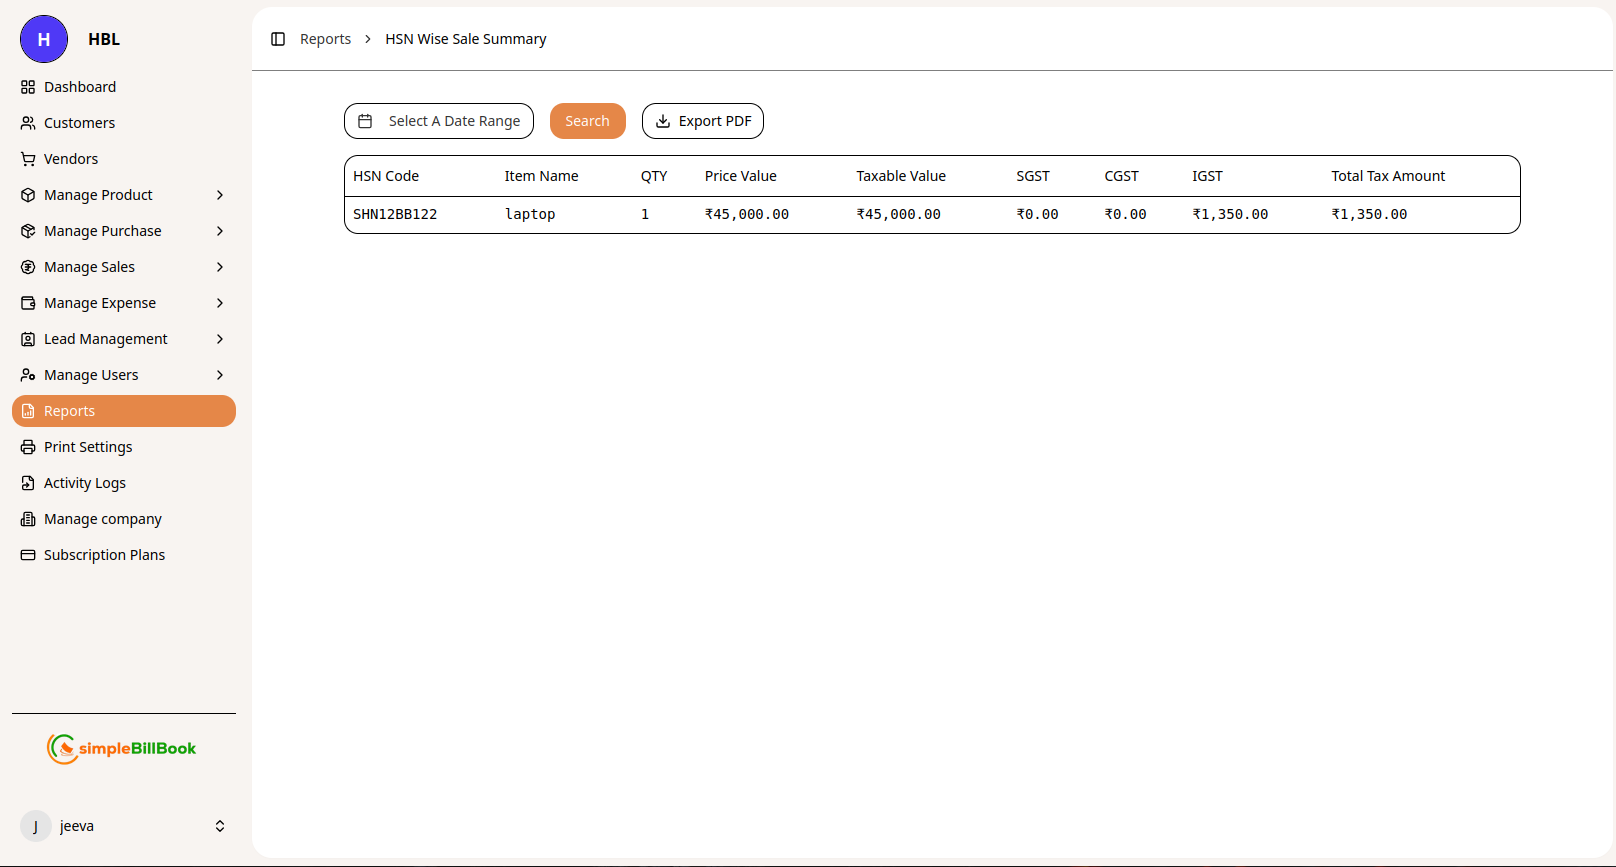 Figure 3: Sales summary grouped by HSN code
Purpose: Summarize sales by HSN code for tax classification and reporting.
Report Columns:
| Column | Description |
|---|---|
| HSN Code | Harmonized System of Nomenclature code |
| Item Name | Product name |
| QTY | Total quantity sold |
| Price Value | Total sales value before tax |
| Taxable Value | Value on which tax is calculated |
| SGST | Total State GST collected |
| CGST | Total Central GST collected |
| IGST | Total Integrated GST collected |
| Total Tax Amount | Sum of all taxes |
Use Cases:
- GST return filing
- Tax liability calculation
- Product category performance analysis
3. Sales Summary Report
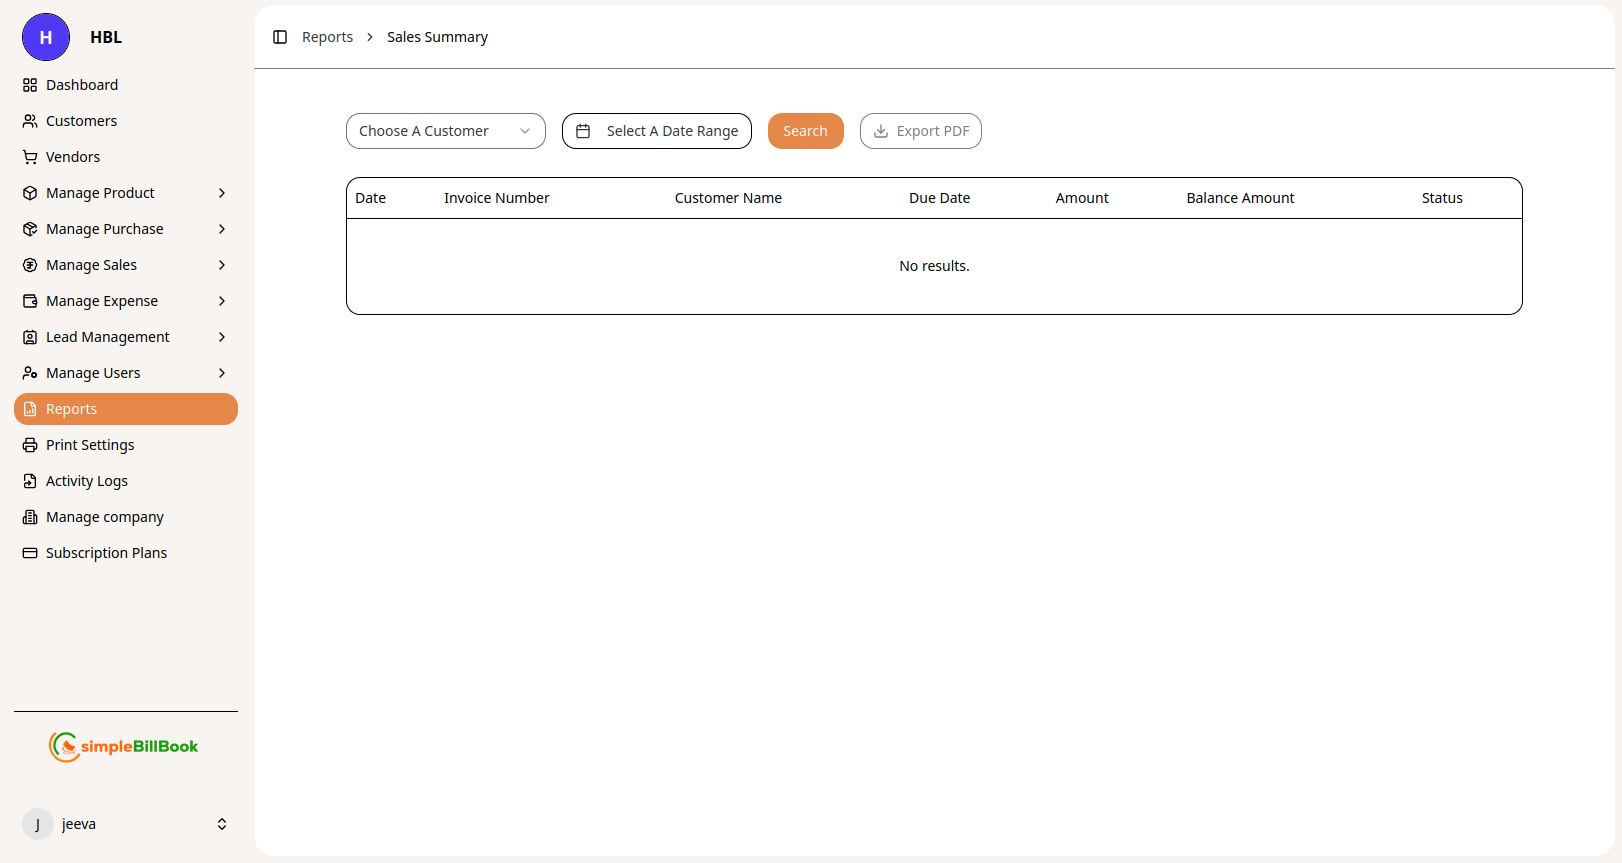 Figure 4: Sales summary report by customer and date range
Purpose: Track and analyze sales transactions with customer-wise details, due dates, and payment status.
Report Columns:
| Column | Description |
|---|---|
| Date | Invoice date |
| Invoice Number | Unique sales invoice identifier |
| Customer Name | Customer name |
| Due Date | Payment due date |
| Amount | Total invoice amount |
| Balance Amount | Outstanding balance to be paid |
| Status | Payment status (Paid, Unpaid, Partial) |
Features:
- Choose A Customer: Filter sales by specific customer
- Select A Date Range: Filter by custom date period
- Search: Find specific invoices or customers
- Export PDF: Generate printable sales summary report
Use Cases:
- Track customer-wise sales performance
- Monitor outstanding receivables
- Identify overdue payments
- Analyze sales trends over time
- Prepare customer statements
Business Insights:
- Which customers generate the most revenue
- Payment patterns and delays by customer
- Seasonal sales variations
- Average collection period
4. GST Purchase Report (With HSN)
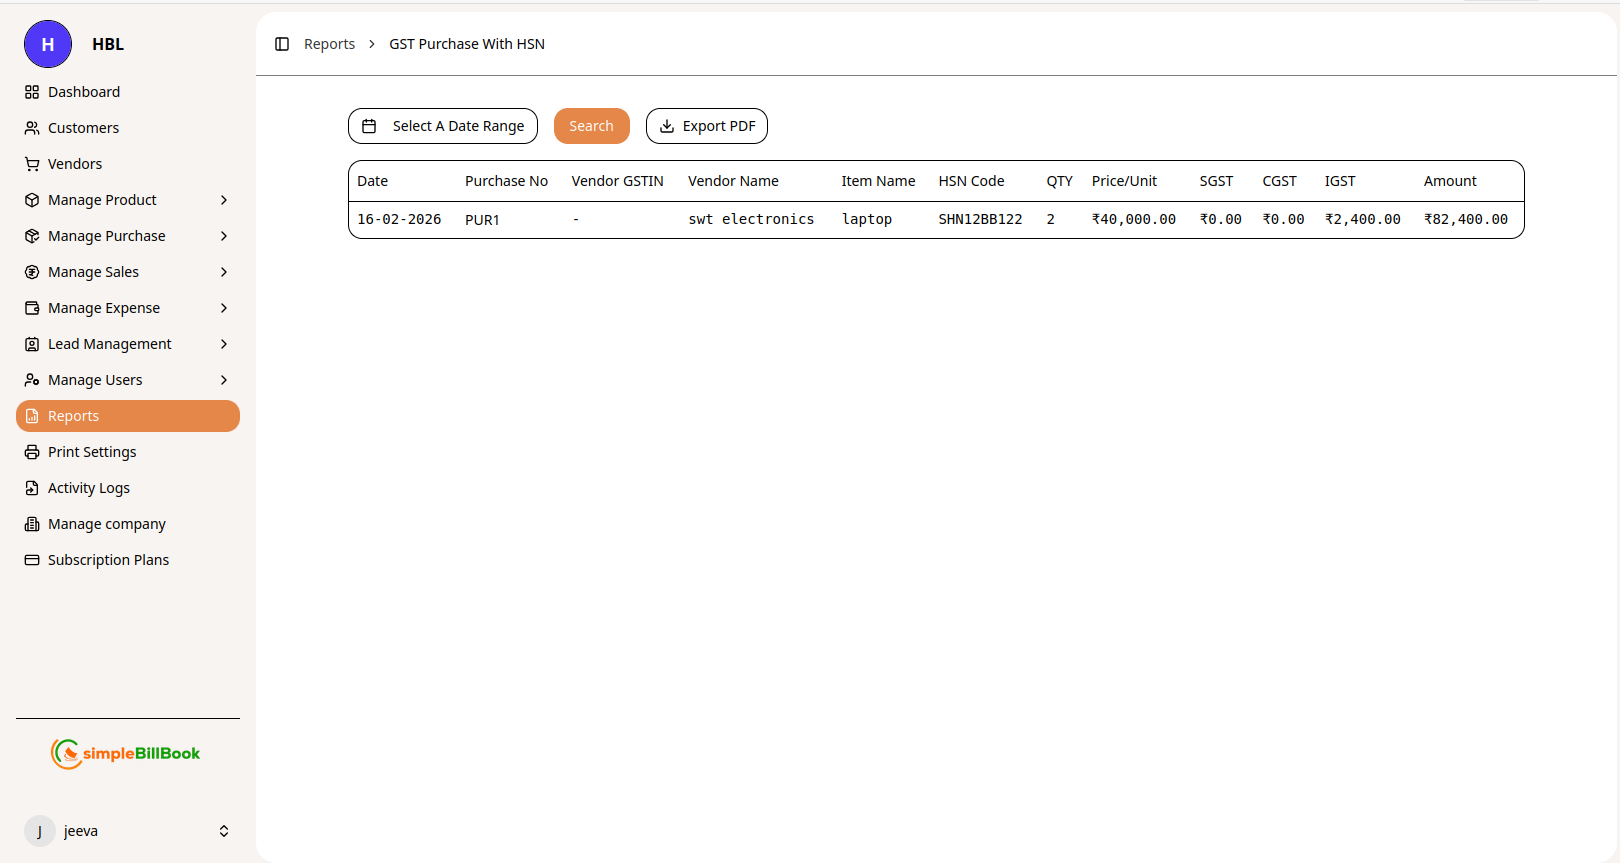 Figure 5: GST Purchase report with HSN code details
Purpose: Track purchases with GST details for input tax credit claims.
Report Columns:
| Column | Description |
|---|---|
| Date | Purchase date |
| Purchase No | Unique purchase entry number |
| Vendor GSTIN | Vendor's GST Identification Number |
| Vendor Name | Vendor/supplier name |
| Item Name | Product purchased |
| HSN Code | HSN classification code |
| QTY | Quantity purchased |
| Price/Unit | Purchase price per unit |
| SGST | State GST paid |
| CGST | Central GST paid |
| IGST | Integrated GST paid |
| Amount | Total purchase amount |
Features:
- Date Range Filtering: Select custom period
- Search: Find specific purchases
- Export PDF: Download for records or tax filing
Importance:
- Claim input tax credit
- Reconcile with vendor statements
- Track GST paid on purchases
5. Expense Summary
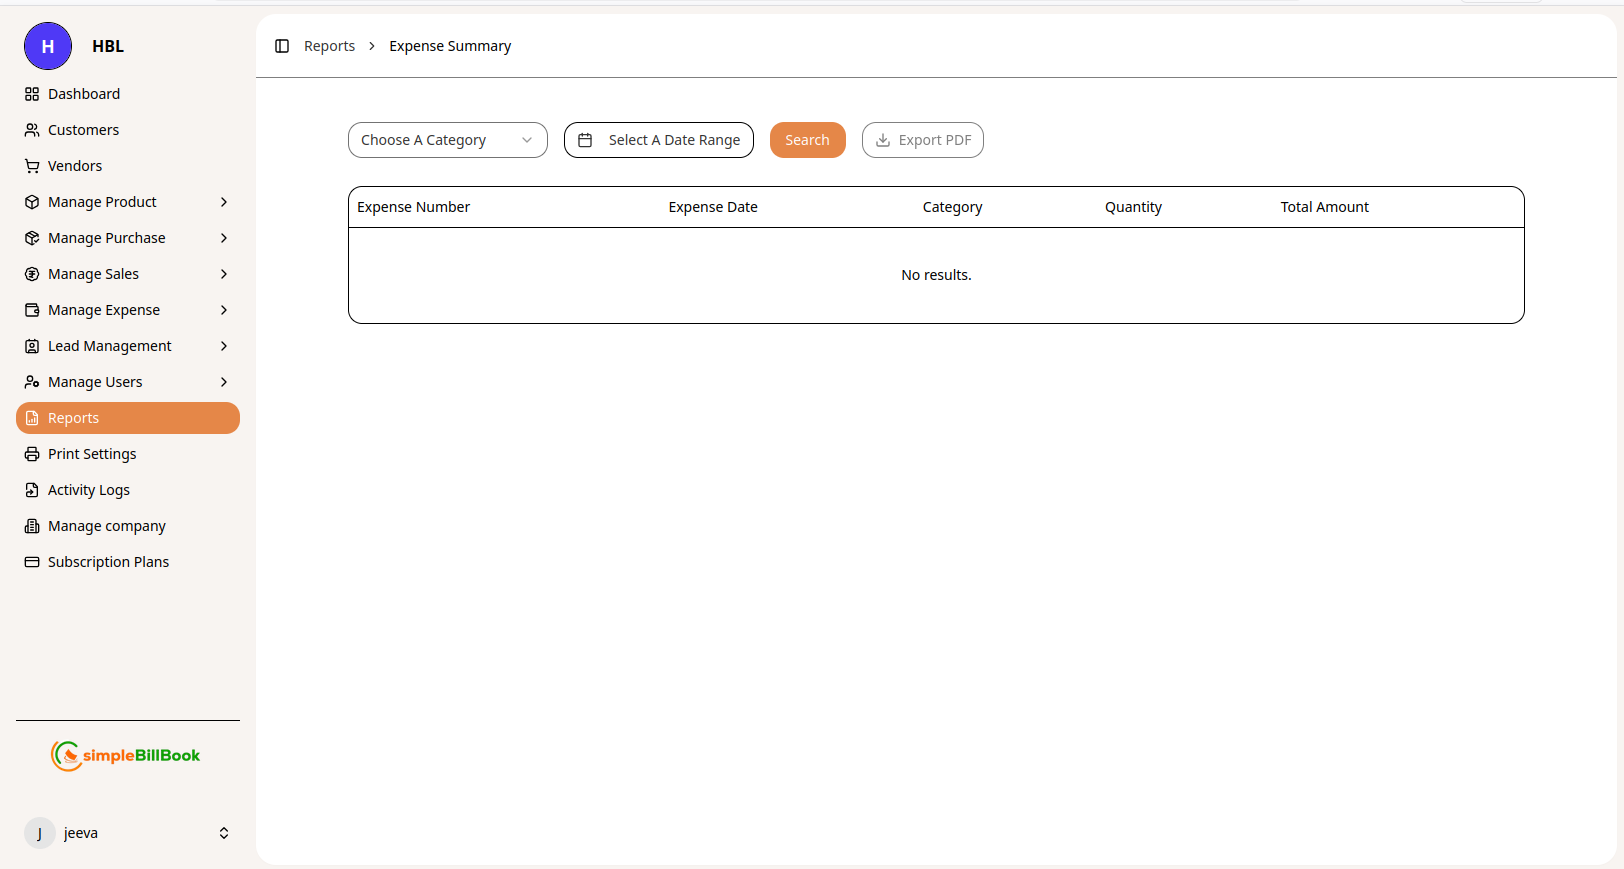 Figure 6: Expense summary report by category
Purpose: Track and analyze business expenses by category.
Report Columns:
| Column | Description |
|---|---|
| Expense Number | Unique expense entry identifier |
| Expense Date | Date expense was incurred |
| Category | Expense category (e.g., digital, home appliance) |
| Quantity | Number of items or units |
| Total Amount | Total expense value |
Features:
- Choose A Category: Filter by specific expense category
- Date Range: Select reporting period
- Search: Find specific expense entries
- Export PDF: Generate expense report
Analysis:
- Identify major expense categories
- Track spending patterns over time
- Budget vs. actual comparison
- Tax deduction preparation
Inventory Reports
1. Stock Summary Report
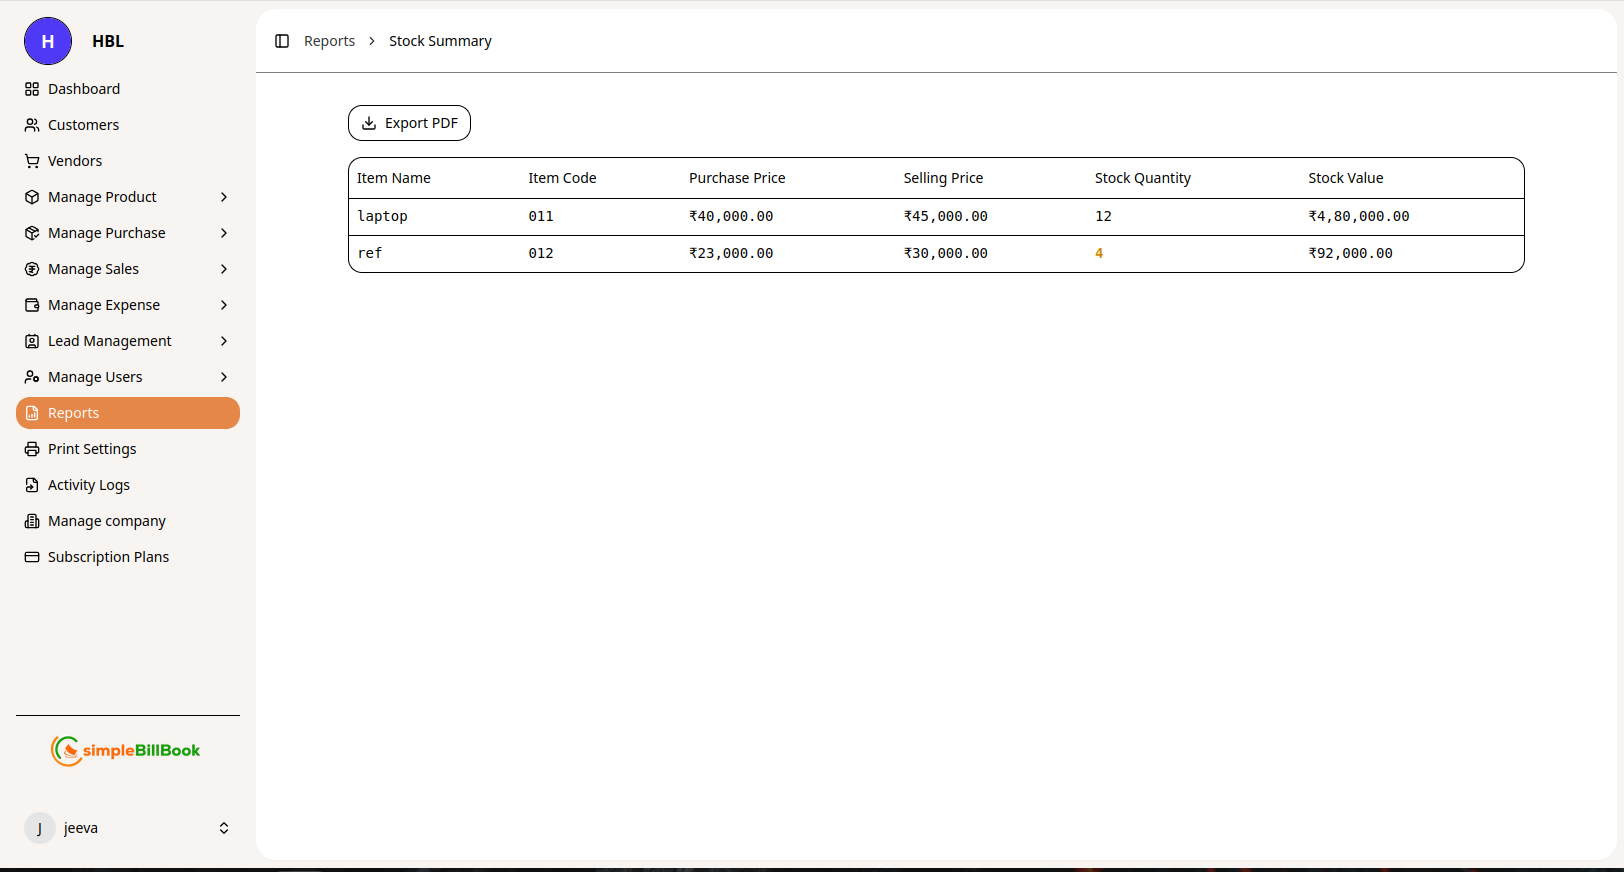 Figure 7: Current stock position with quantities and values
Purpose: Get a snapshot of current inventory levels and stock value.
Report Columns:
| Column | Description |
|---|---|
| Item Name | Product name |
| Item Code | Unique product identifier |
| Purchase Price | Cost price per unit |
| Selling Price | Retail price per unit |
| Stock Quantity | Current available quantity |
| Stock Value | Total value of current stock (Qty × Purchase Price) |
Sample Data:
| Item Name | Item Code | Purchase Price | Selling Price | Stock Qty | Stock Value |
|---|---|---|---|---|---|
| micro oven | 01 | ₹8,000.00 | ₹9,000.00 | 5 | ₹40,000.00 |
| dishwasher | 2 | ₹13,000.00 | ₹14,000.00 | 10 | ₹1,30,000.00 |
| home theatre | 112 | ₹5,000.00 | ₹8,000.00 | 5 | ₹25,000.00 |
| tablet | 23 | ₹25,000.00 | ₹30,000.00 | 2 | ₹50,000.00 |
| ac | 111 | ₹50,000.00 | ₹60,000.00 | 6 | ₹3,00,000.00 |
| ref | 33 | ₹50,000.00 | ₹60,000.00 | 5 | ₹2,50,000.00 |
Use Cases:
- Inventory valuation
- Reorder planning
- Capital tied up in inventory
- Profit margin analysis
2. Stock Detail Report
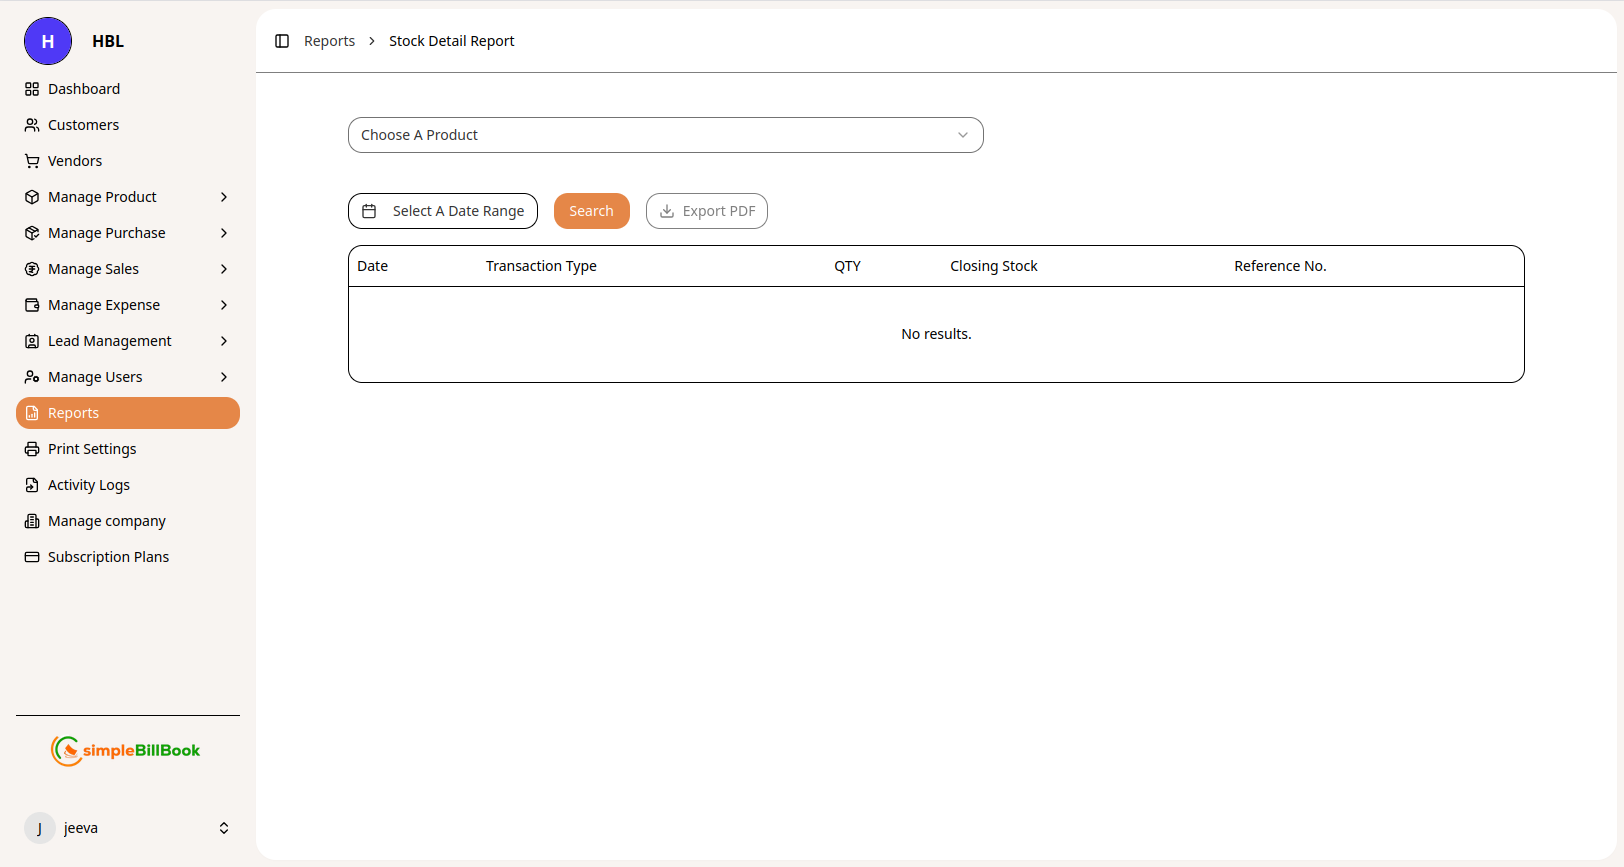 Figure 8: Detailed stock movement history for specific products
Purpose: Track stock movements and transaction history for individual products.
Report Columns:
| Column | Description |
|---|---|
| Date | Transaction date |
| Transaction Type | Purchase, Sale, Return, Adjustment |
| QTY | Quantity added or removed |
| Closing Stock | Balance after transaction |
| Reference No. | Invoice, purchase, or order number |
Features:
- Choose A Product: Select specific item to analyze
- Search: Find specific transactions
- Export PDF: Download movement history
Analysis:
- Identify fast-moving vs. slow-moving items
- Track stock receipt and issue patterns
- Audit inventory transactions
- Investigate stock discrepancies
3. Sales And Purchase Summary
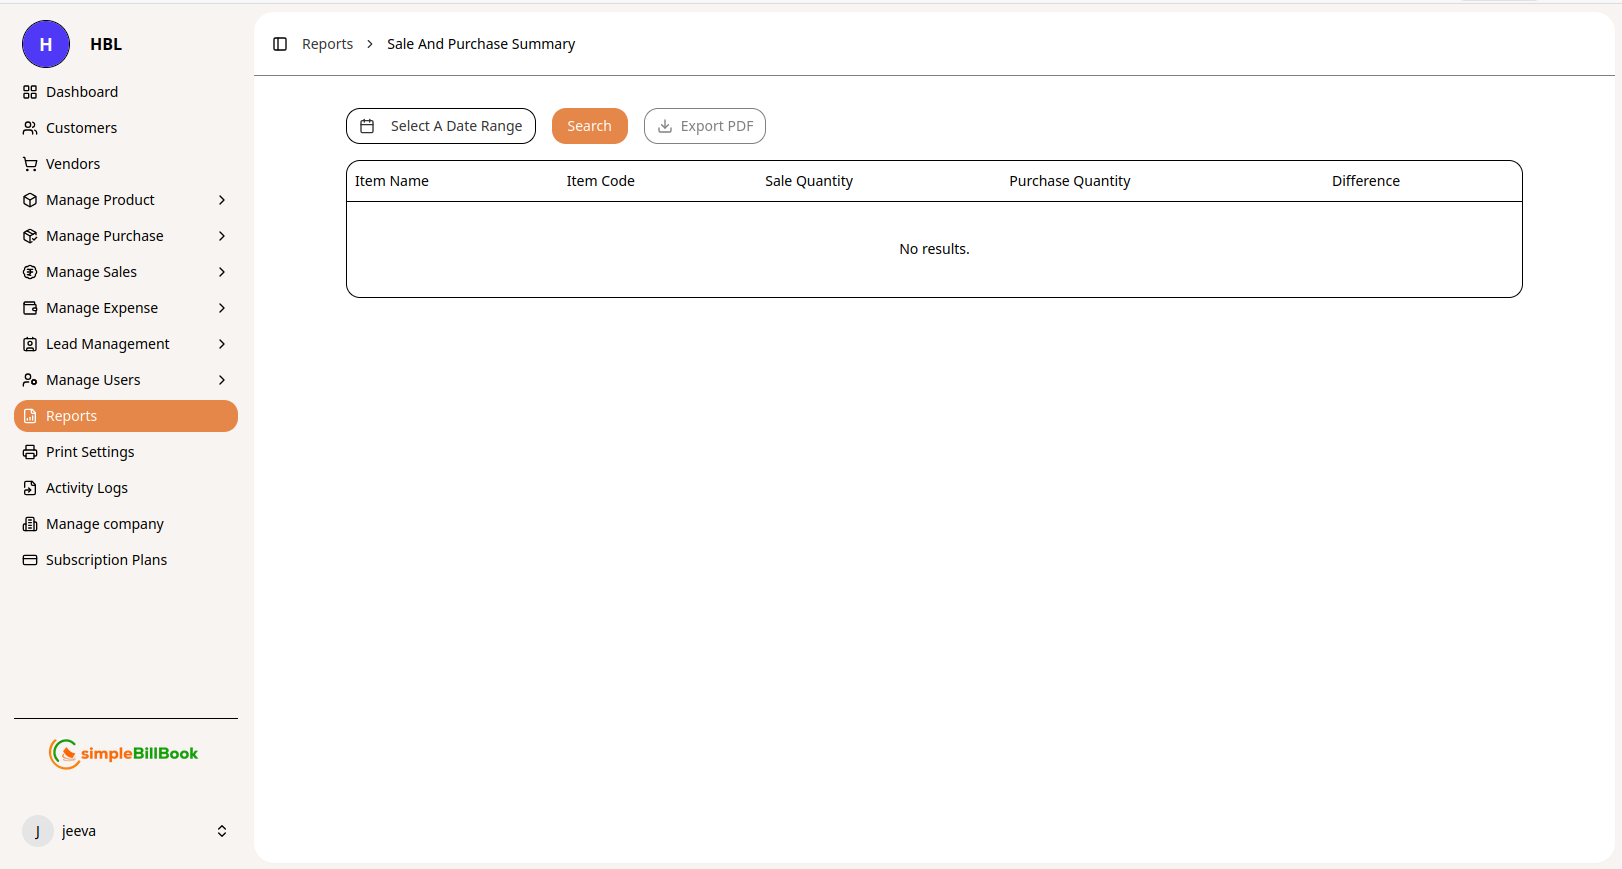 Figure 9: Comparison of sales and purchase quantities by product
Purpose: Compare sales volume against purchase volume for each product.
Report Columns:
| Column | Description |
|---|---|
| Item Name | Product name |
| Item Code | Unique product identifier |
| Sale Quantity | Total units sold in period |
| Purchase Quantity | Total units purchased in period |
| Difference | Sale Qty - Purchase Qty (net position) |
Features:
- Date Range Selection: Filter by custom period
- Search: Find specific products
- Export PDF: Generate comparative report
Business Insights:
- Identify best-selling products
- Detect stock shortages or excess
- Plan purchasing based on sales velocity
- Calculate stock turnover rate
4. Rate List of Products
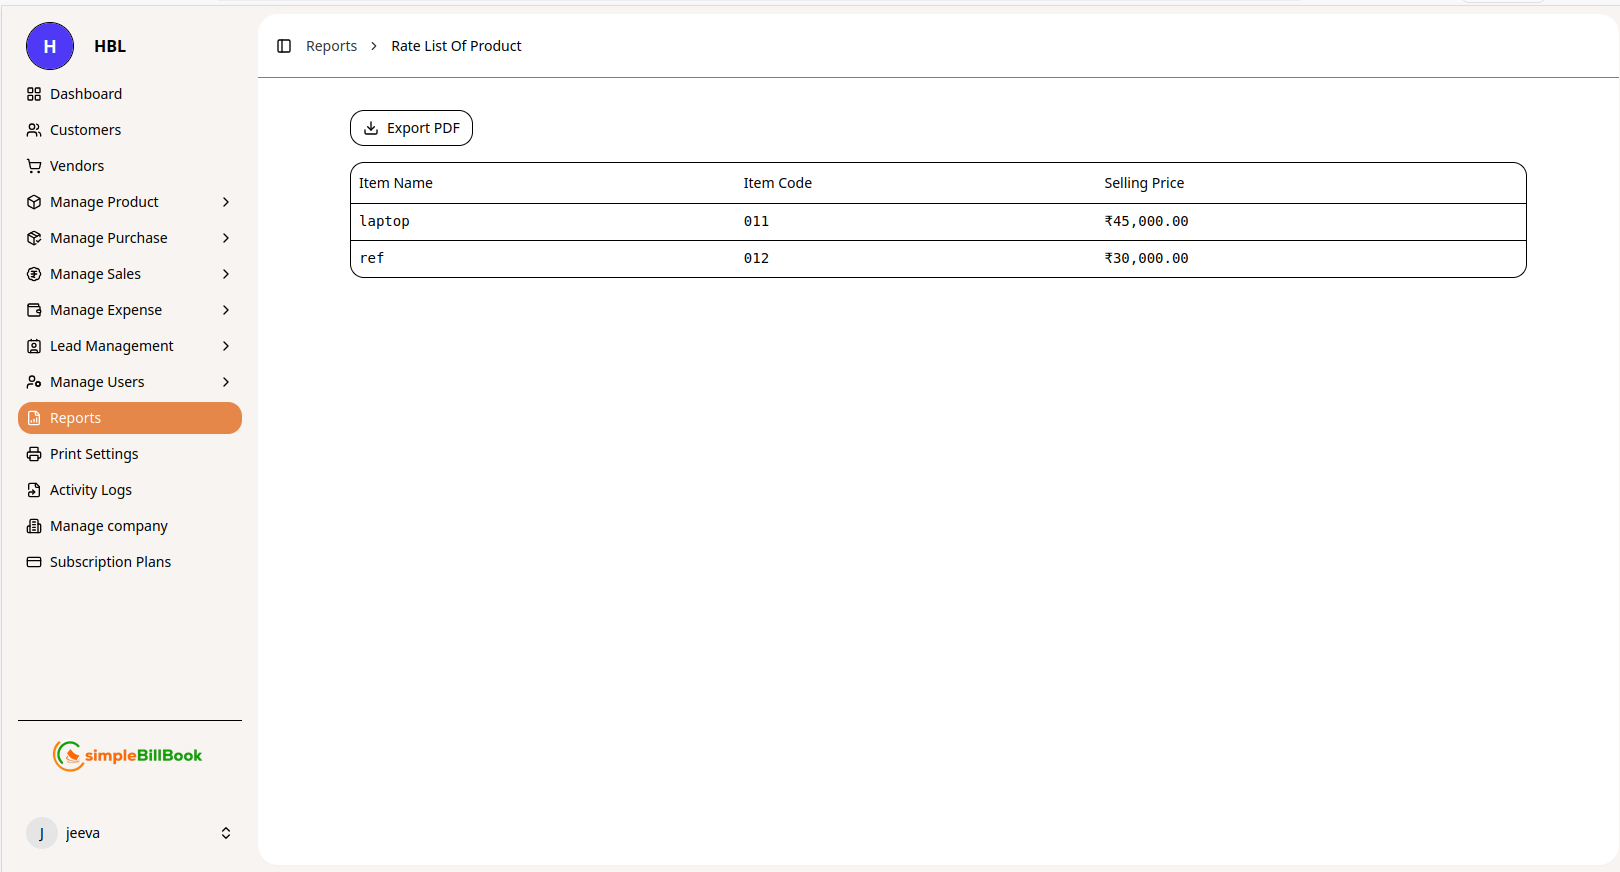 Figure 10: Complete price list of all products
Purpose: Generate a comprehensive price list for all products with selling prices.
Report Columns:
| Column | Description |
|---|---|
| Item Name | Product name |
| Item Code | Unique product identifier |
| Selling Price | Current retail price |
Sample Data:
| Item Name | Item Code | Selling Price |
|---|---|---|
| ac | 111 | ₹60,000.00 |
| dishwasher | 2 | ₹14,000.00 |
| home theatre | 112 | ₹8,000.00 |
| laptop | 04 | ₹25,000.00 |
| macbook | 60 | ₹70,000.00 |
| micro oven | 01 | ₹9,000.00 |
| mobile | 22 | ₹40,000.00 |
| ps5 | 44 | ₹45,000.00 |
| ref | 33 | ₹60,000.00 |
| tablet | 23 | ₹30,000.00 |
| tv | 11 | ₹25,000.00 |
| washing machine | 55 | ₹60,000.00 |
Use Cases:
- Share price list with customers
- Train sales staff on pricing
- Audit price consistency
- Prepare catalogs and quotations
Common Report Features
Date Range Selection
Most reports include date range filters allowing you to:
- Select predefined periods (Today, This Week, This Month, This Quarter, This Year)
- Set custom start and end dates
- Compare periods (Month-over-Month, Year-over-Year)
Search Functionality
- Search across all columns
- Find specific transactions, customers, vendors, or products
- Filter by keywords or exact matches
Customer Filtering
Reports like Sales Summary allow filtering by:
- Specific customer to view their transaction history
- All customers for complete overview
- Customer groups or categories
Export Options
- Export PDF: Generate formatted PDF reports for printing or sharing
- Format may include company logo, headers, and footers
- Professional presentation for clients or tax authorities
Best Practices for Report Generation
1. Regular Reporting Schedule
- Daily: Quick sales and cash position
- Weekly: Sales trends, stock movement
- Monthly: Complete financial and GST reports
- Quarterly: Business performance review
- Annually: Annual summary for tax filing
2. Data Accuracy
- Ensure all transactions are entered correctly
- Reconcile reports with bank statements
- Investigate and correct discrepancies promptly
- Maintain clean master data (HSN codes, product details)
3. Report Interpretation
- Understand what each metric represents
- Compare against historical data for trends
- Look for anomalies or unusual patterns
- Share insights with relevant team members
4. Documentation
- Save critical reports for audit trail
- Maintain organized report archive
- Document report definitions and calculations
- Note any adjustments or corrections
5. Compliance
- Ensure GST reports match filed returns
- Retain reports as required by tax laws
- Generate reports before tax due dates
- Verify HSN code accuracy
Integration with Other Modules
Sales Module:
- GST Sales Report: Pulls data from sales invoices
- Sales Summary: Aggregates customer-wise sales data
- HSN Summary: Aggregates by product classification
- Rate List: Uses current selling prices
Customer Management:
- Sales Summary: Links to customer profiles
- Customer Filtering: View sales by specific customer
- Outstanding Tracking: Monitor customer balances
Purchase Module:
- GST Purchase Report: Uses purchase entry data
- Input Tax Credit: Tracks GST paid on purchases
Inventory Module:
- Stock Summary: Real-time inventory position
- Stock Detail: Transaction history by product
- Sale vs. Purchase: Comparative analysis
Expense Module:
- Expense Summary: Categorized expenditure tracking
Common Scenarios and Solutions
Scenario 1: Preparing for GST Return Filing
Solution:
- Generate GST Sales (With HSN) report for the tax period
- Generate HSN Wise Sales Summary for classification
- Generate GST Purchase (With HSN) report for input tax credit
- Verify totals against GSTR-1 and GSTR-3B requirements
- Export PDF for records and audit trail
Scenario 2: Monthly Business Review Meeting
Solution:
- Run Sales Summary for month-over-month comparison
- Filter by customer to identify top clients
- Generate Expense Summary by category
- Check Stock Summary for inventory health
- Prepare Rate List for pricing review
- Export all reports to PDF for presentation
Scenario 3: Customer Account Statement
Solution:
- Navigate to Sales Summary report
- Select specific customer from "Choose A Customer" dropdown
- Set appropriate date range
- View all invoices with due dates and balances
- Export PDF to share with customer
Scenario 4: Stock Audit and Reorder Planning
Solution:
- Run Stock Summary to identify low-stock items
- Generate Sales And Purchase Summary for movement analysis
- Check Stock Detail Report for fast-moving items
- Create purchase orders based on data
Scenario 5: Overdue Payment Tracking
Solution:
- Generate Sales Summary report
- Filter by date range
- Sort by due date and balance amount
- Identify customers with overdue invoices
- Initiate collection follow-up
Scenario 6: Expense Control Review
Solution:
- Generate Expense Summary by date range
- Filter by category to identify high-cost areas
- Compare with previous periods
- Investigate significant increases
- Implement cost control measures